Top Story
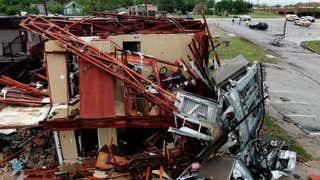
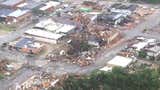
HEARTBREAKING DEVASTATION


Welcome.
Please enter a city or zip code to get your most accurate weather forecast.


Our Changing World

Trending Weather
Stay Safe

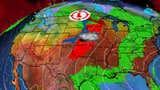
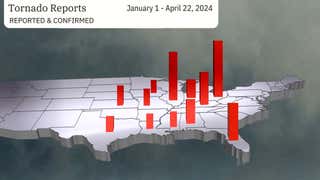
Weather Today Across the Country


Your Privacy
To personalize your product experience, we collect data from your device. We also may use or disclose to specific data vendors your precise geolocation data to provide the Services. To learn more please refer to our Privacy Policy.
Choose how my information is shared